5G walkers and exposure measurements in public areas
The 5G wanderer was out and about again, visiting 300 micro-environments and 188 public places by the end of 2023. Measurements were also taken on 238 journeys on public transport. The measured field strength values increase with the degree of urbanisation.
Highest median values at airports and bus stops
In public areas, the highest median values of electromagnetic fields were found at airports, tram and bus stops. Magnetic fields were highest at railway stations, tram stops and on trains. The immission limit values are utilised to a maximum of 13 % in the LF-MF measurements and up to 6 % in the HF-EMF measurements.
Changes in exposure between 2021 and 2023
A comparison between 2021 and 2023 showed that exposure remained roughly similar in 75 microenvironments and 43 public areas. An increase in RF-EMF exposure was found in trains and airports. This is probably due to the increased passenger volume and thus the number of mobile phone users. In most measurement environments, the magnetic field strength remained the same between 2021 and 2023. Magnetic field strengths increased in railway stations and tram stops in 2023 and decreased in trains and metros.
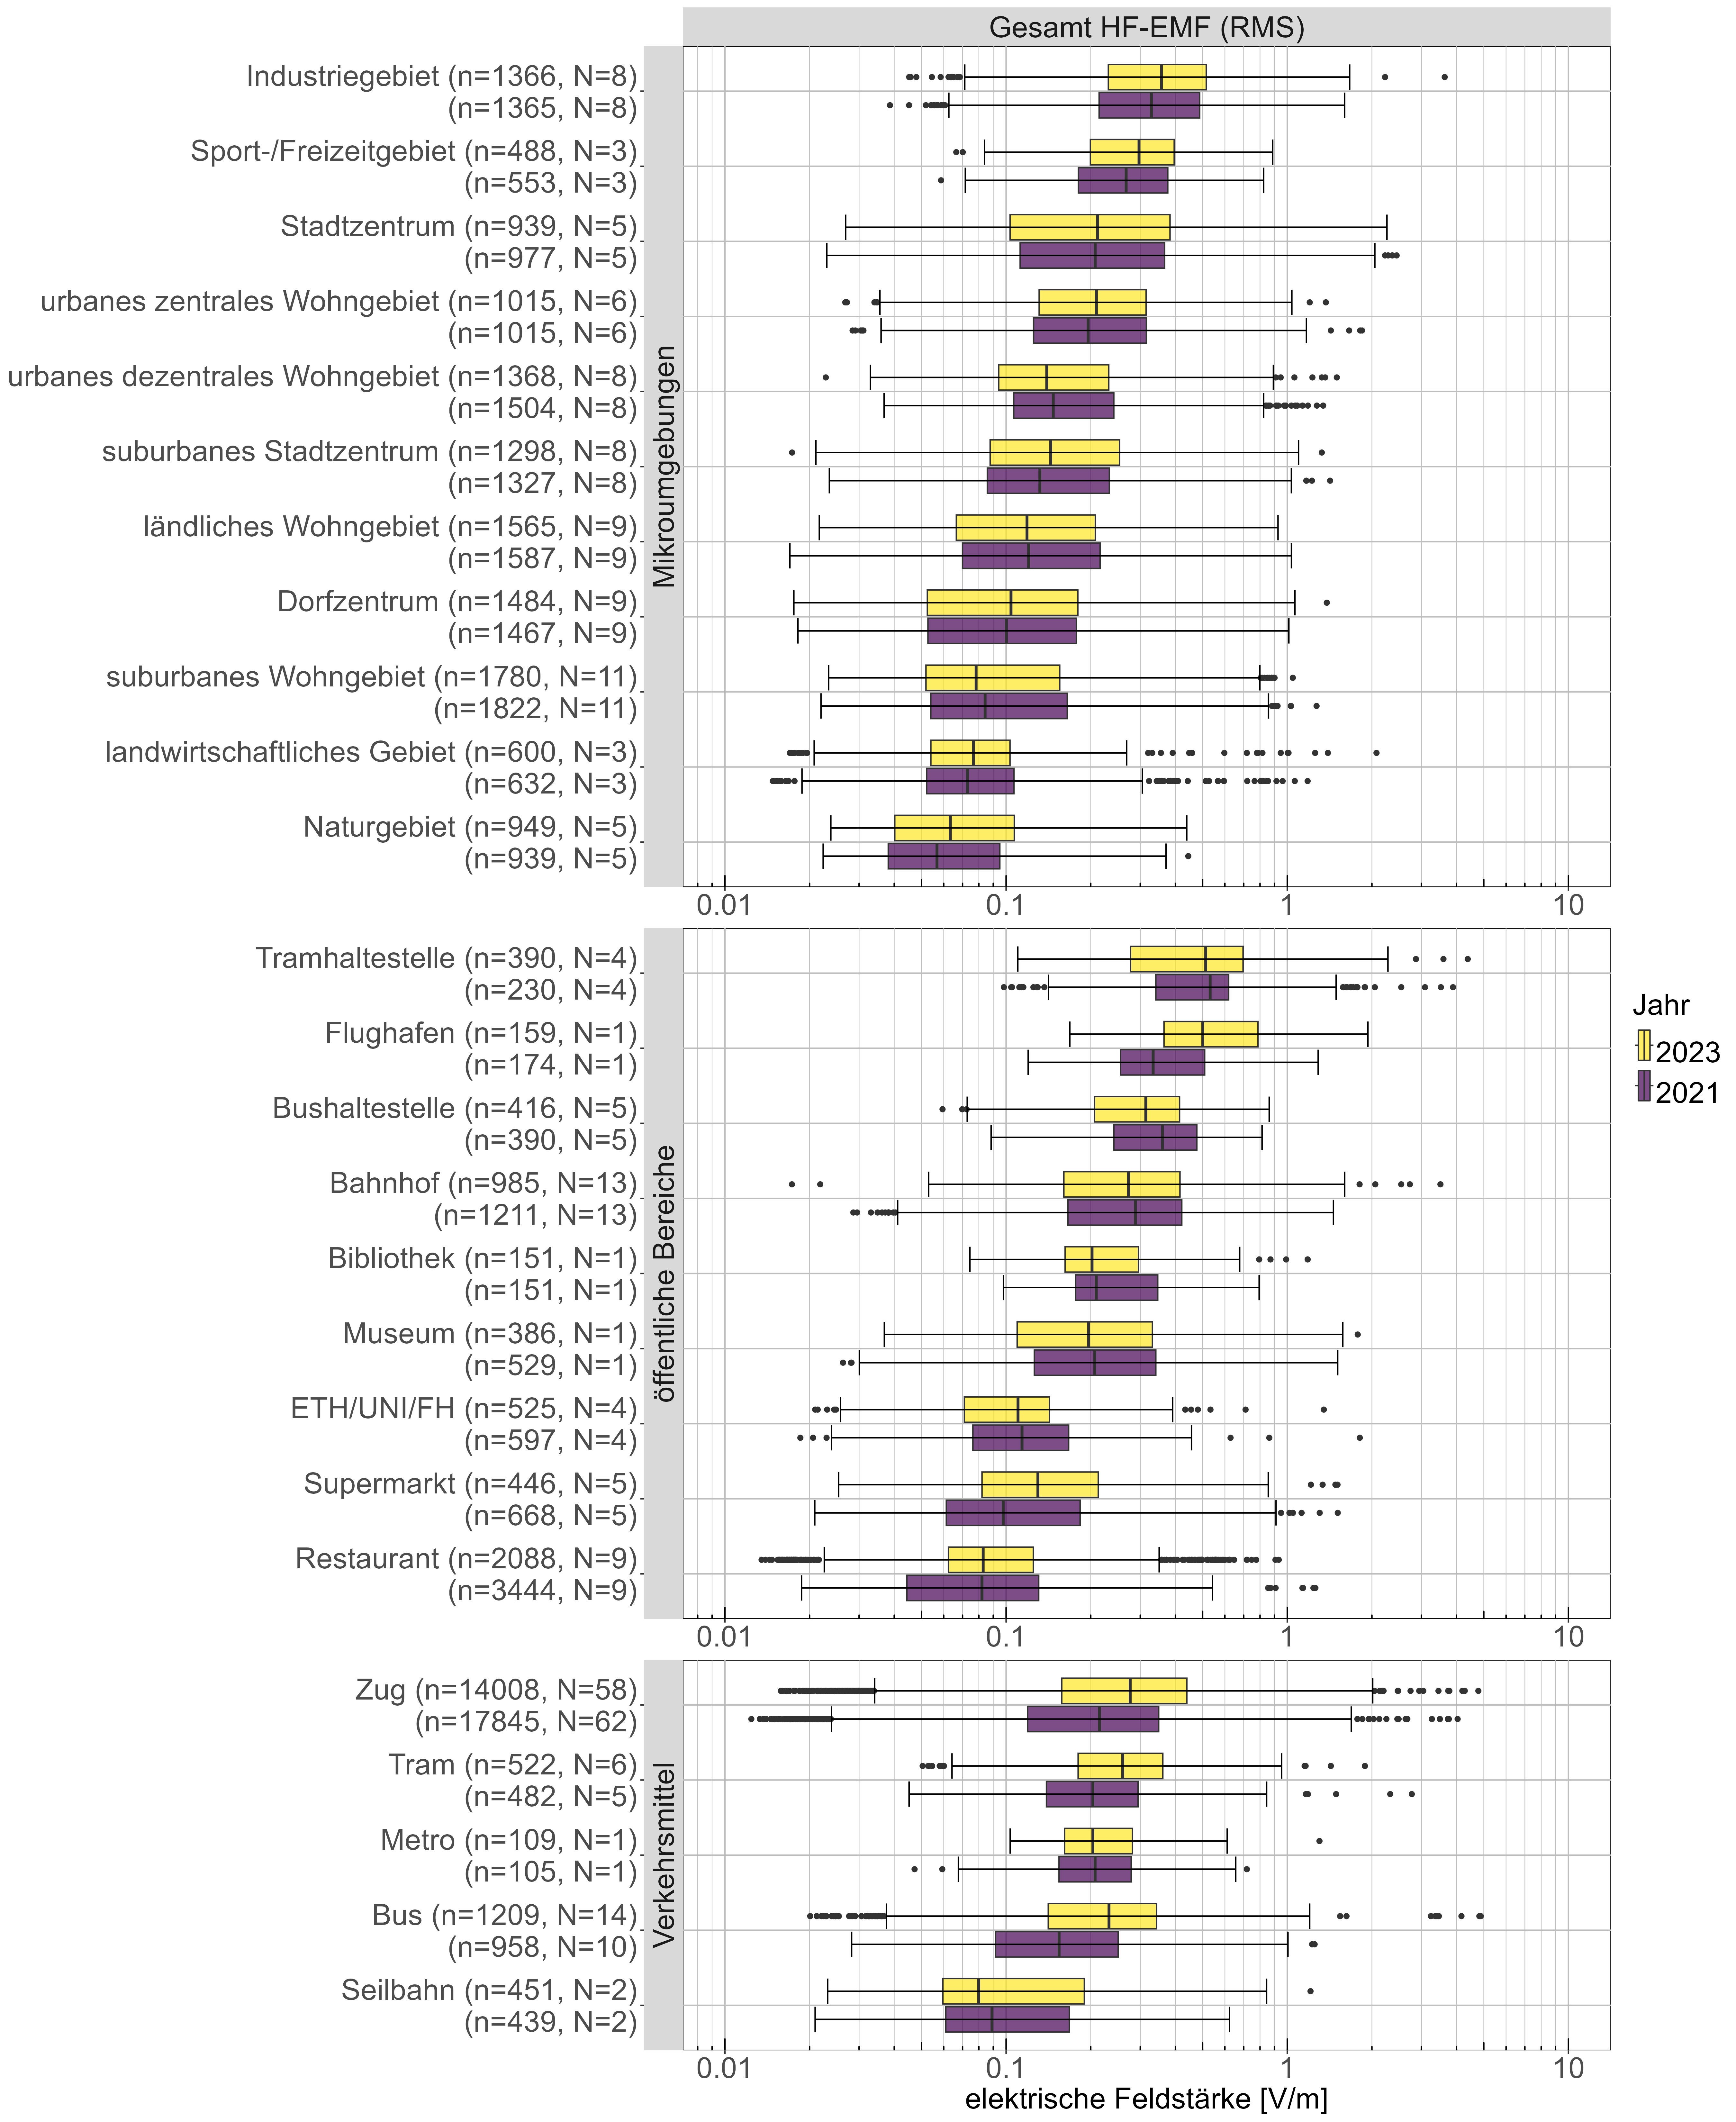
Comparison of the distribution of the RMS HF-EMF measured values in the same measurement environments in 2021 (purple) and 2023 (yellow). The centre line shows the median, the bar the 25th and 75th percentiles. Extreme values lie outside the 1.5*IQR (interquartile range) and are shown as individual points. The number of data points used is indicated by n below the neighbourhood designation. The number of measurements at locations with the same primary source is denoted as N.
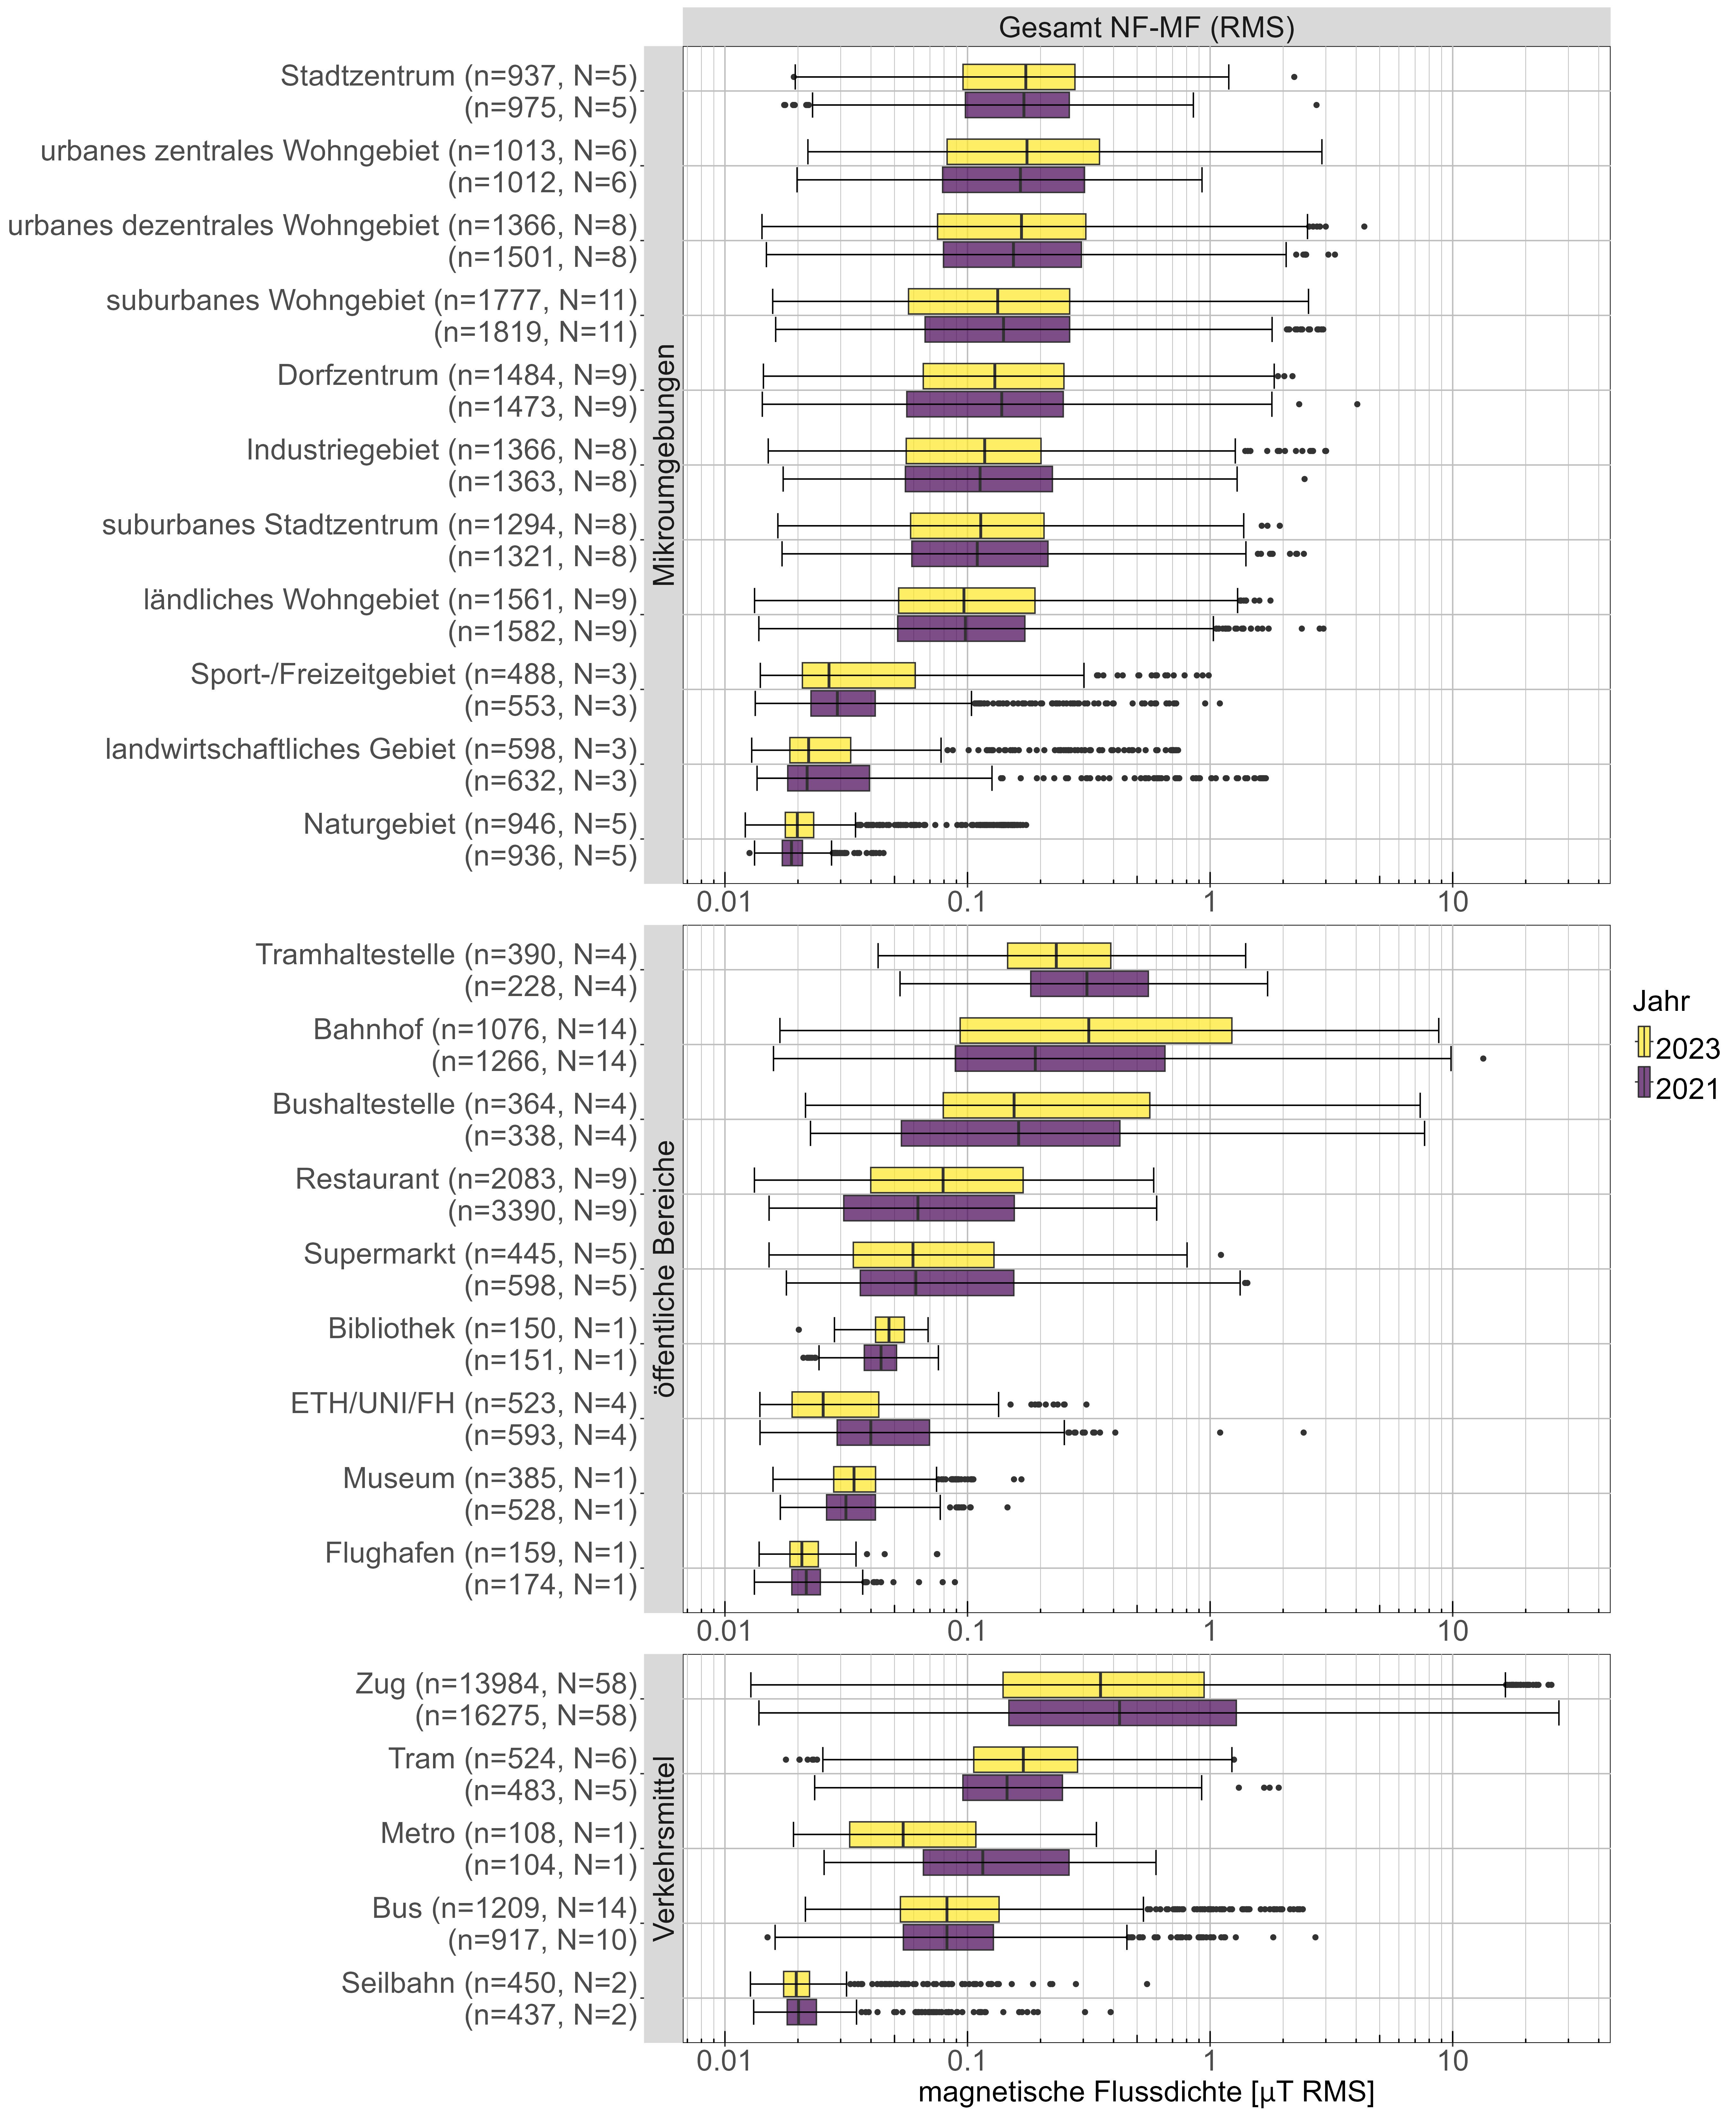
Comparison of the distribution of the RMS NF-MF measured values in the same measurement environments in 2021 (purple) and 2023 (yellow). The centre line shows the median, the bar the 25th and 75th percentiles. Extreme values lie outside the 1.5*IQR (interquartile range) and are shown as individual points. The number of data points used is indicated by n below the neighbourhood designation. The number of measurements at locations with the same primary source is denoted as N.
Measurements of magnetic fields in homes
In 75 flats, ten-minute measurements were taken in the living room and on a route through the entire property. Measurements were taken in the bedroom for 24 hours. Due to the attenuating building envelope, the RF-EMF values inside the building are often lower than outside.
Influence of mobile phone systems and radio transmitters on field strength
In the vicinity of mobile phone base stations, the downlink makes the largest contribution to the total field strength. In homes close to radio/TV transmitters, this source contributes the most to the total field strength. Across all measurements, the highest median field strength values were measured in properties close to radio transmitters. Unlike mobile phone antennas, broadcasting services are usually emitted in all directions (isotropic) and the building envelope attenuates less at low frequencies.
Field contributions from WLAN and DECT telephones in the living room
During the measurements in the living room, the field contributions from WLAN and DECT telephones were comparatively high, as these devices are often placed there due to the connections.
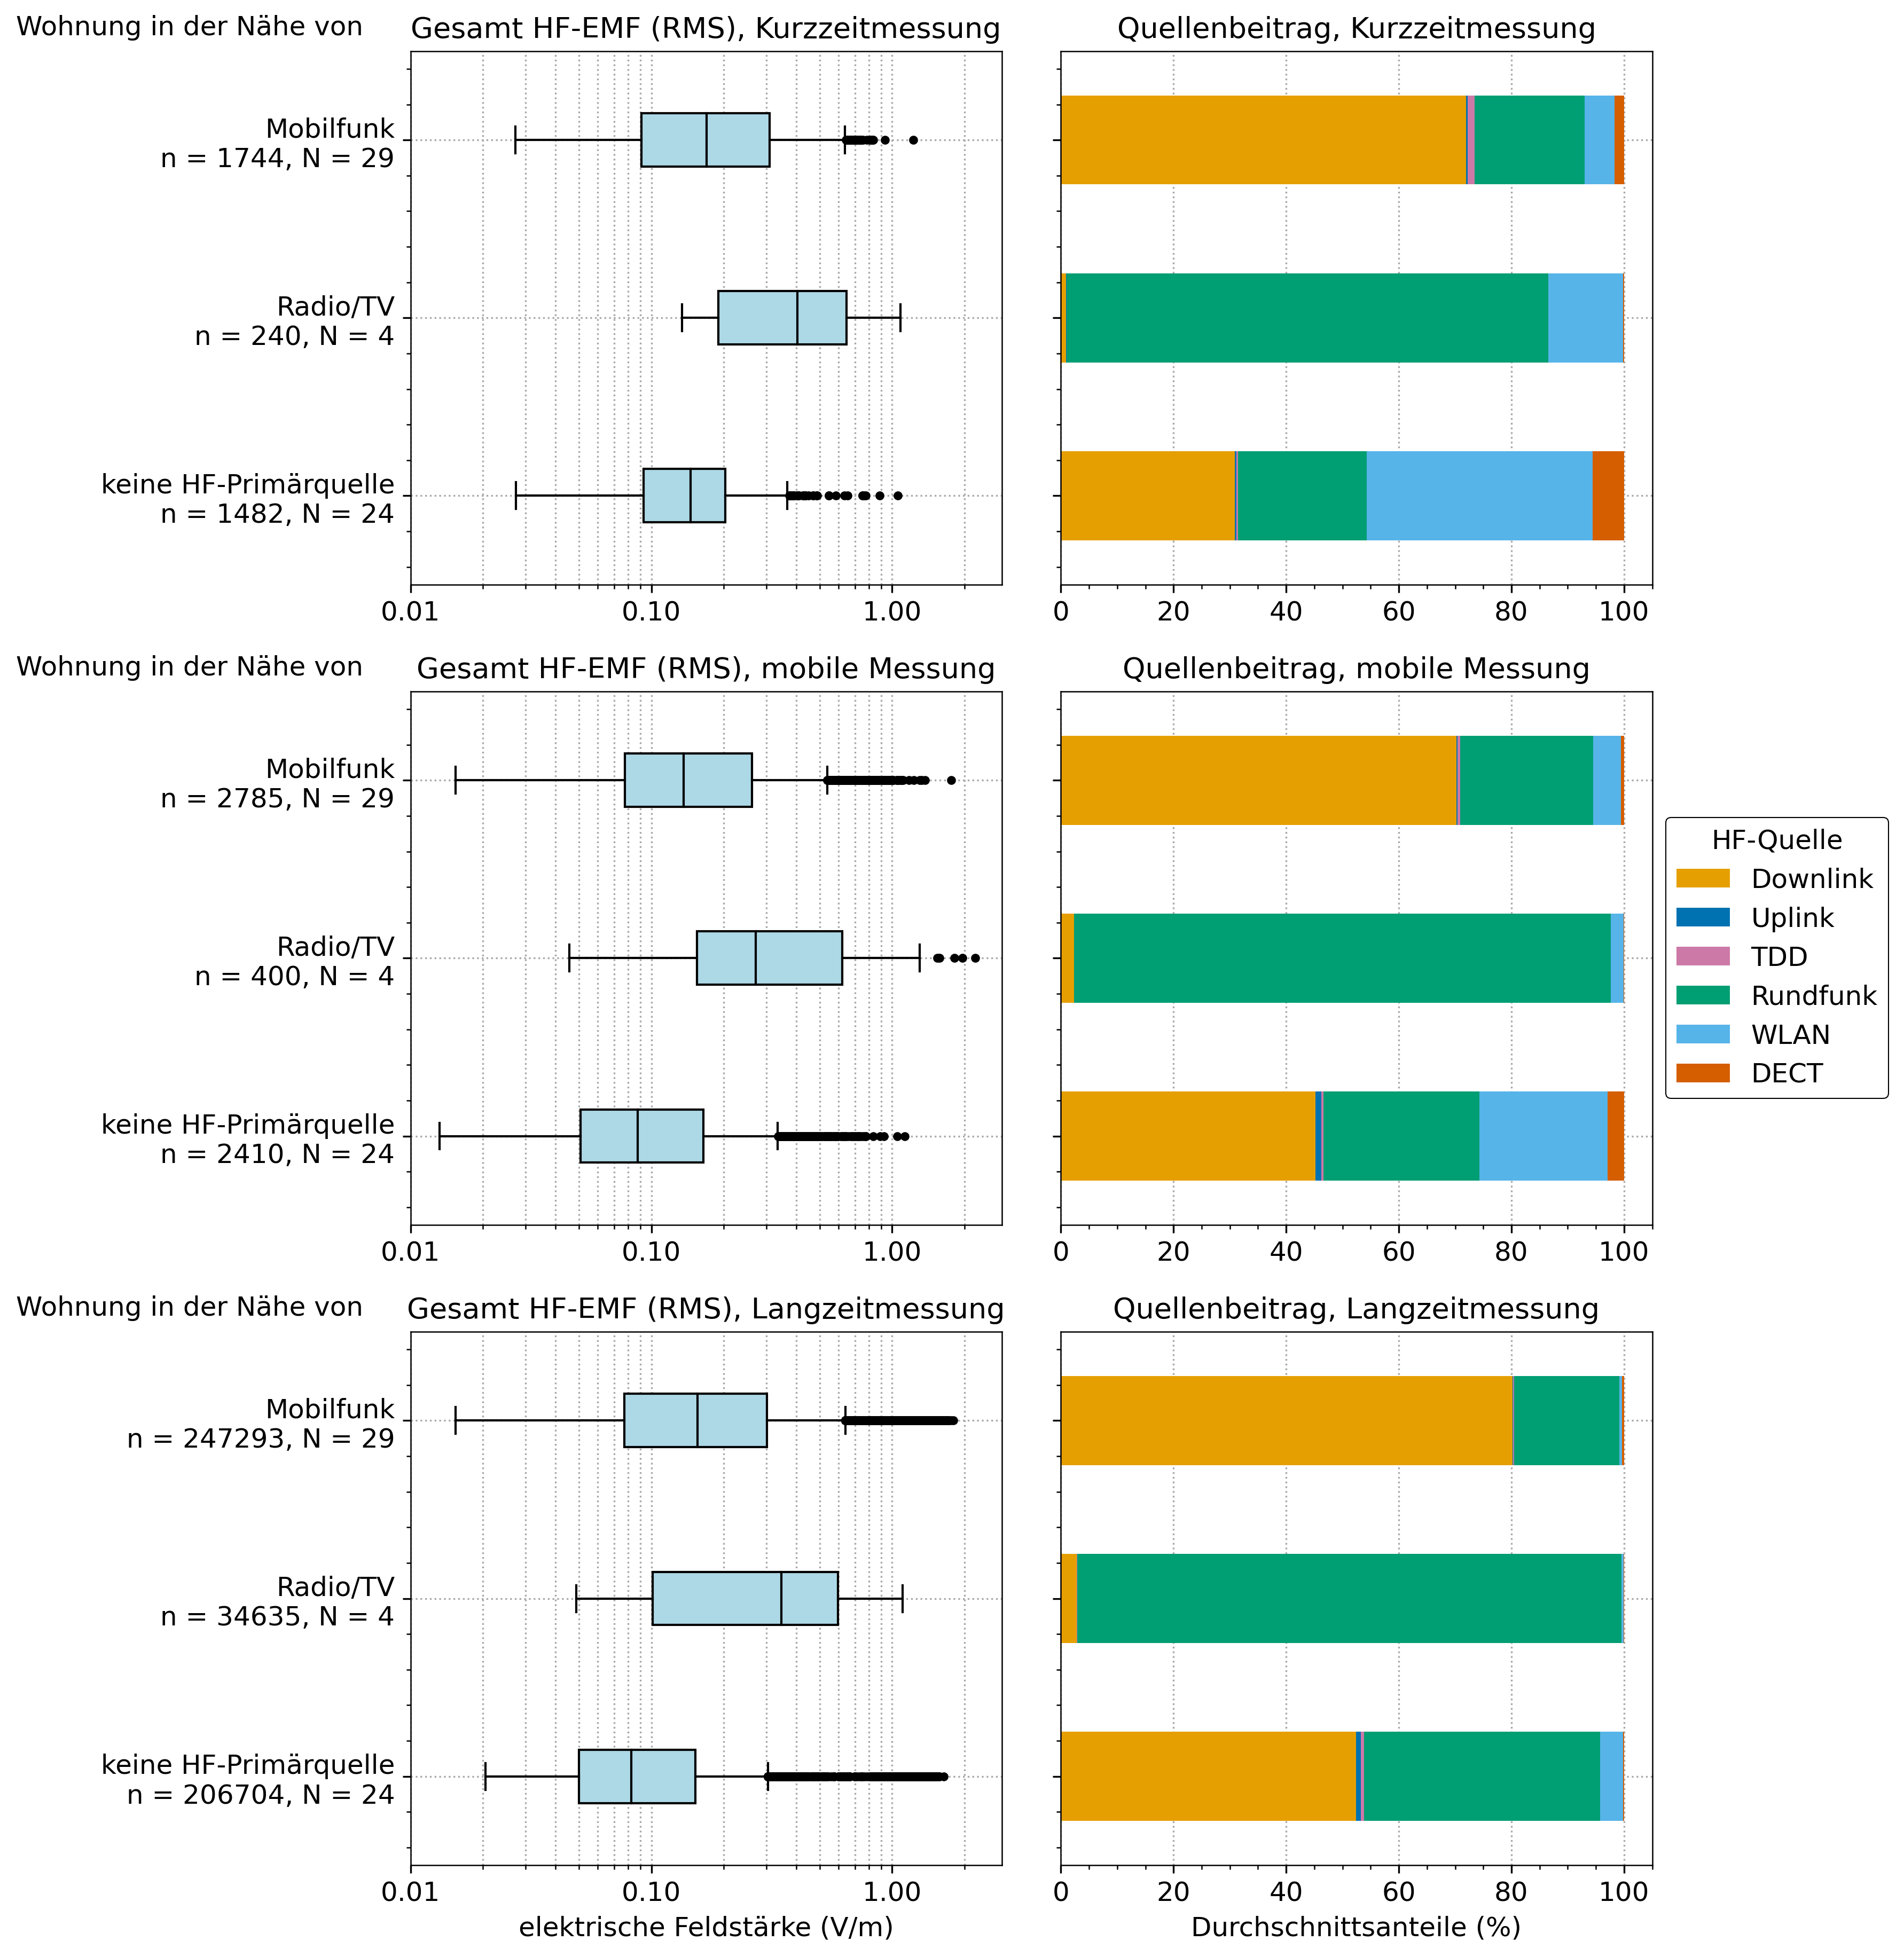
Left panel: Total RF-EMF (RMS) values of the spot measurements, grouped by partial measurement (short-term measurement, mobile measurement and long-term measurement) and the primary RF source in the vicinity of the measurement location. Properties without a primary RF source are randomly selected and represent the typical EMF exposure in Switzerland. The centre line shows the median and the blue bar the 25th and 75th percentiles. Outliers are outside the 1.5*IQR (interquartile range) and are shown as single points. n denotes the number of data points and N denotes the number of measurement sites. Right panel: Percentage composition of the frequency band groups in the mean total RMS field strength.
Magnetic fields in the vicinity of high-voltage power lines
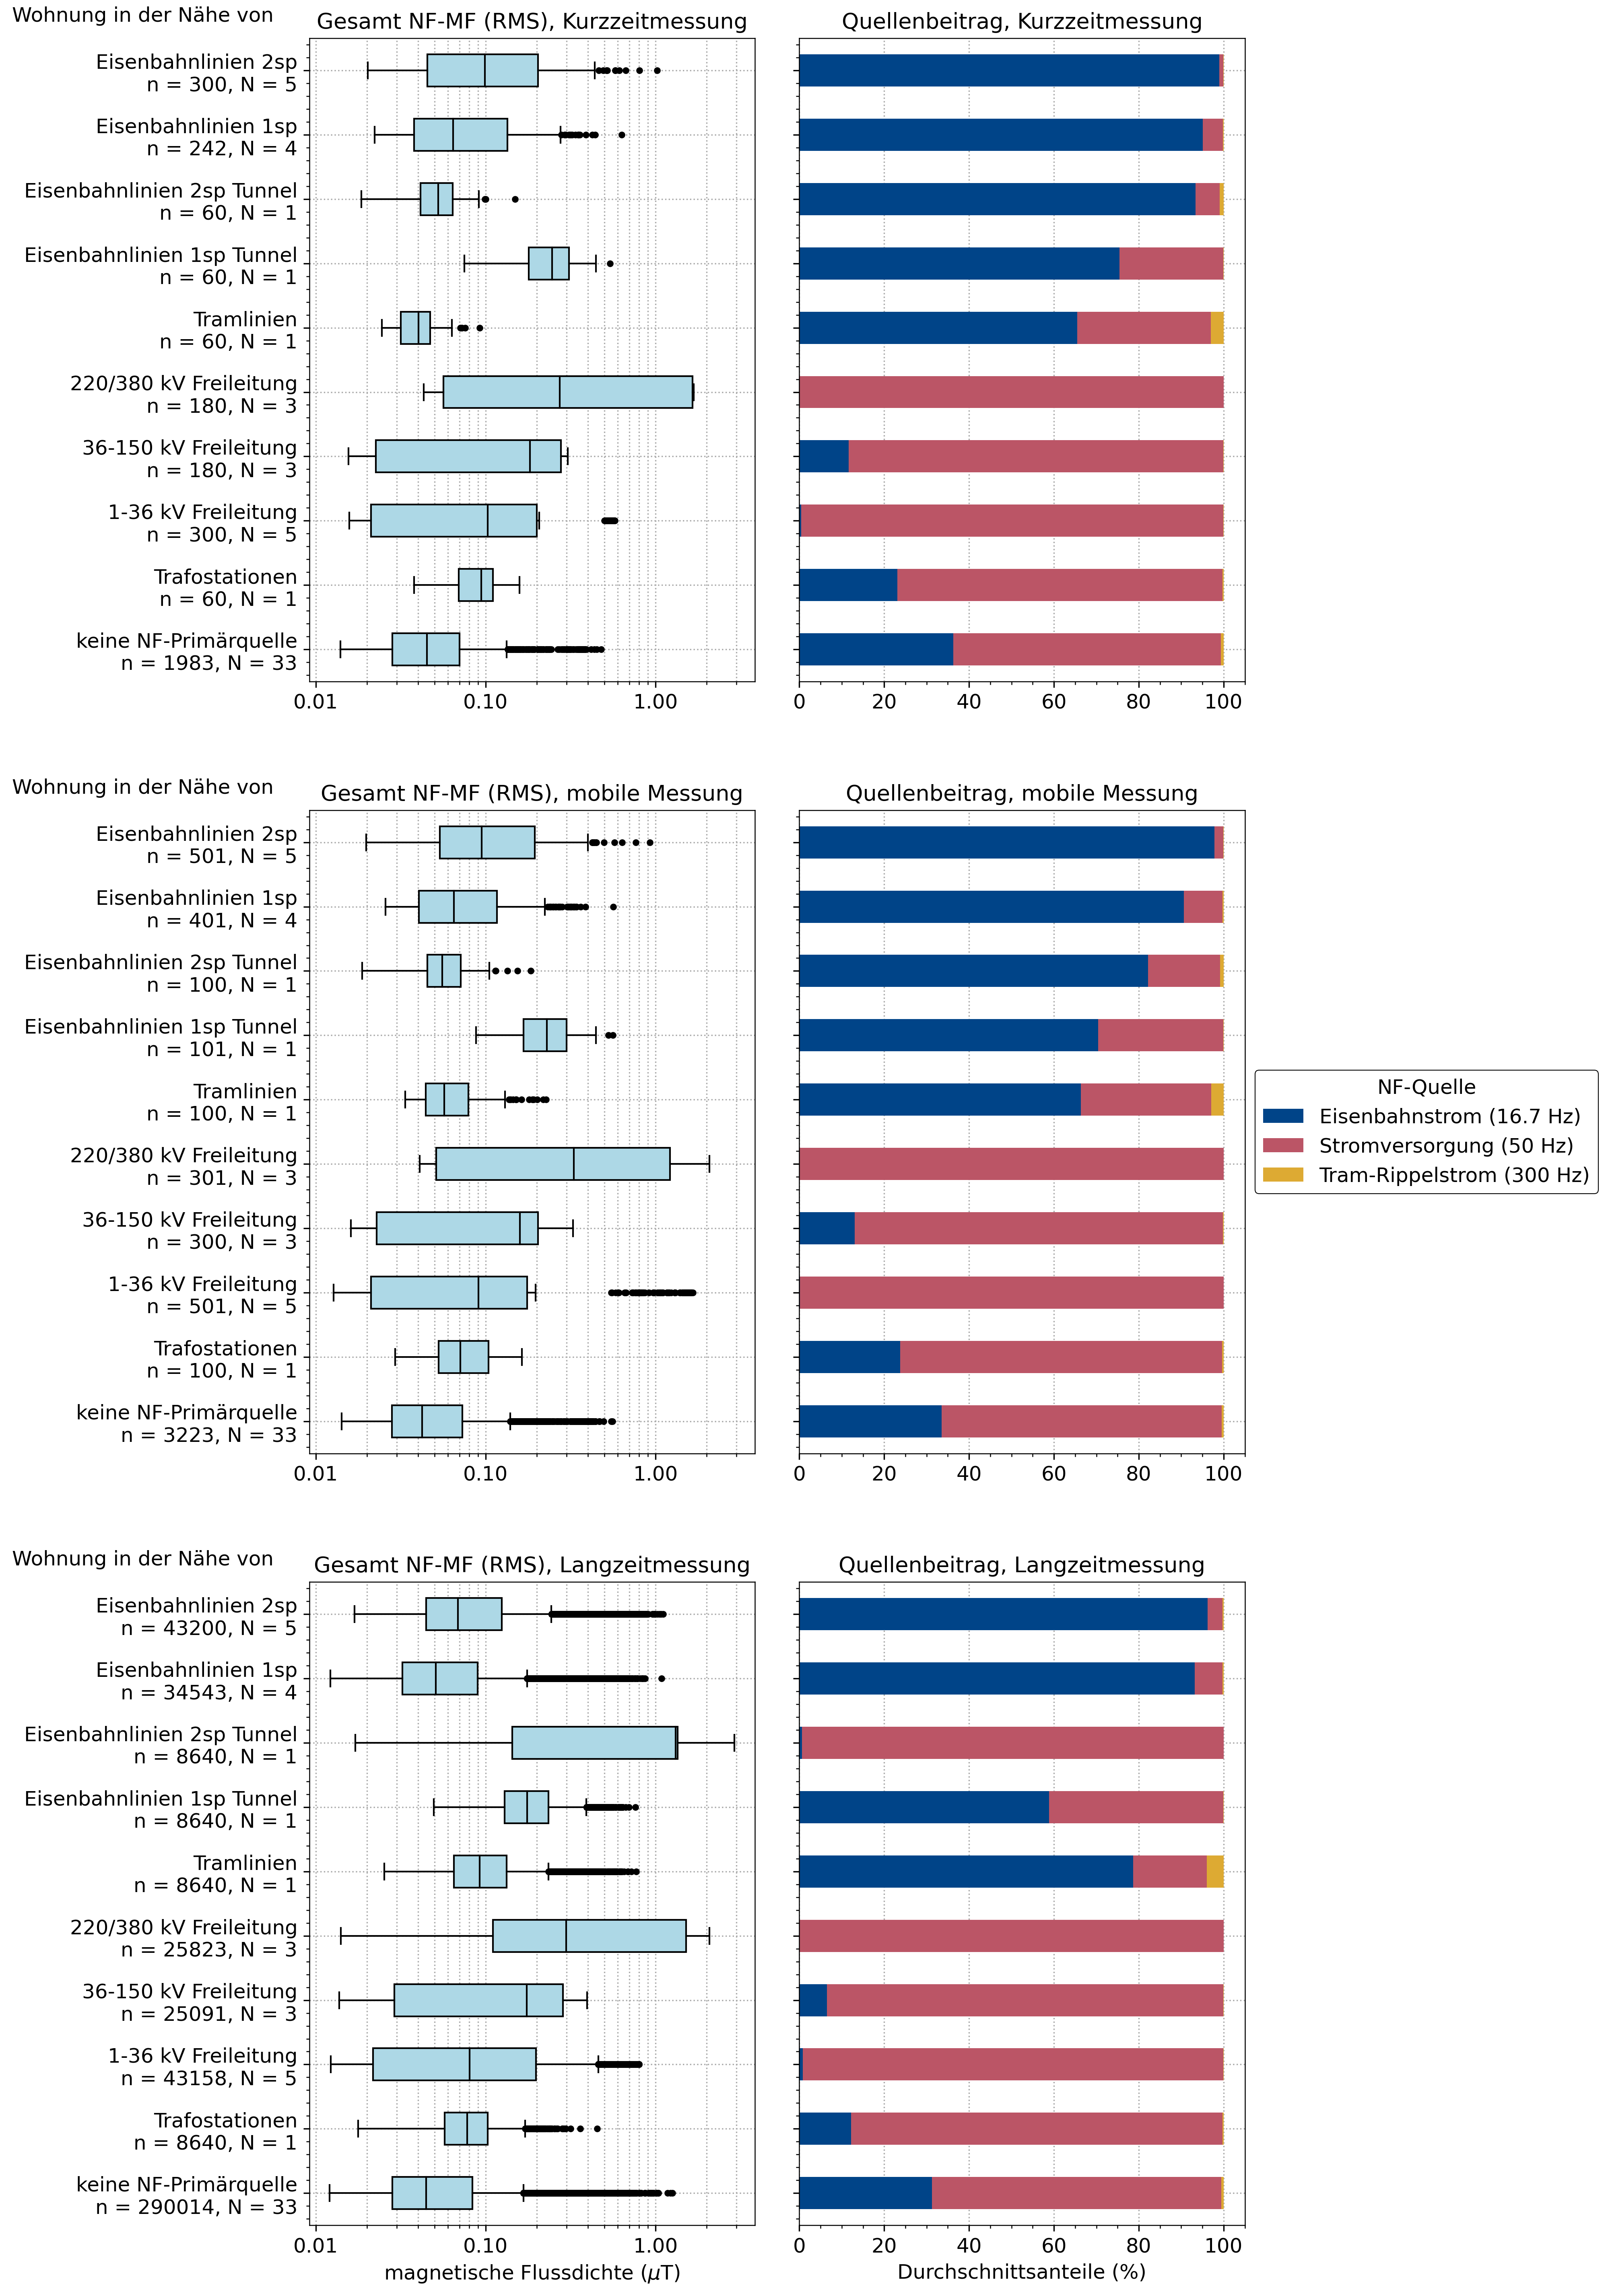
Exposure to magnetic fields is greatest for properties in the vicinity of 220/380 kV overhead lines. In a bedroom measurement near a two-lane tunnel, the measured field strength values presumably originate primarily from a heated waterbed.
Left panel: Total RF-MF (RMS) values of the spot measurements, grouped by partial measurement (short-term measurement, mobile measurement and long-term measurement) and the primary RF source in the vicinity of the measurement location. Properties without a primary RF source are randomly selected and represent the typical EMF exposure in Switzerland. The centre line shows the median and the blue bar the 25th and 75th percentiles. Outliers are outside the 1.5*IQR (interquartile range) and are shown as single points. n denotes the number of data points and N denotes the number of measurement sites. Right panel: Percentage composition of the frequency band groups in the mean total RMS field strength.
Stationary permanent measuring stations and daily course of the field strength
This year's report now presents the results of the stationary permanent measuring stations in Zurich, Aarau, Deitingen, Neuchâtel and Allschwil. The measurement data recorded over the entire year 2023 was analysed. The highest field strength values were measured in Zurich, Deitingen and Aarau. The analysis of the daily patterns shows that the field strength values are high at midday and in the evening (8 p.m. to 10 p.m.), when the number of mobile phone users is highest.
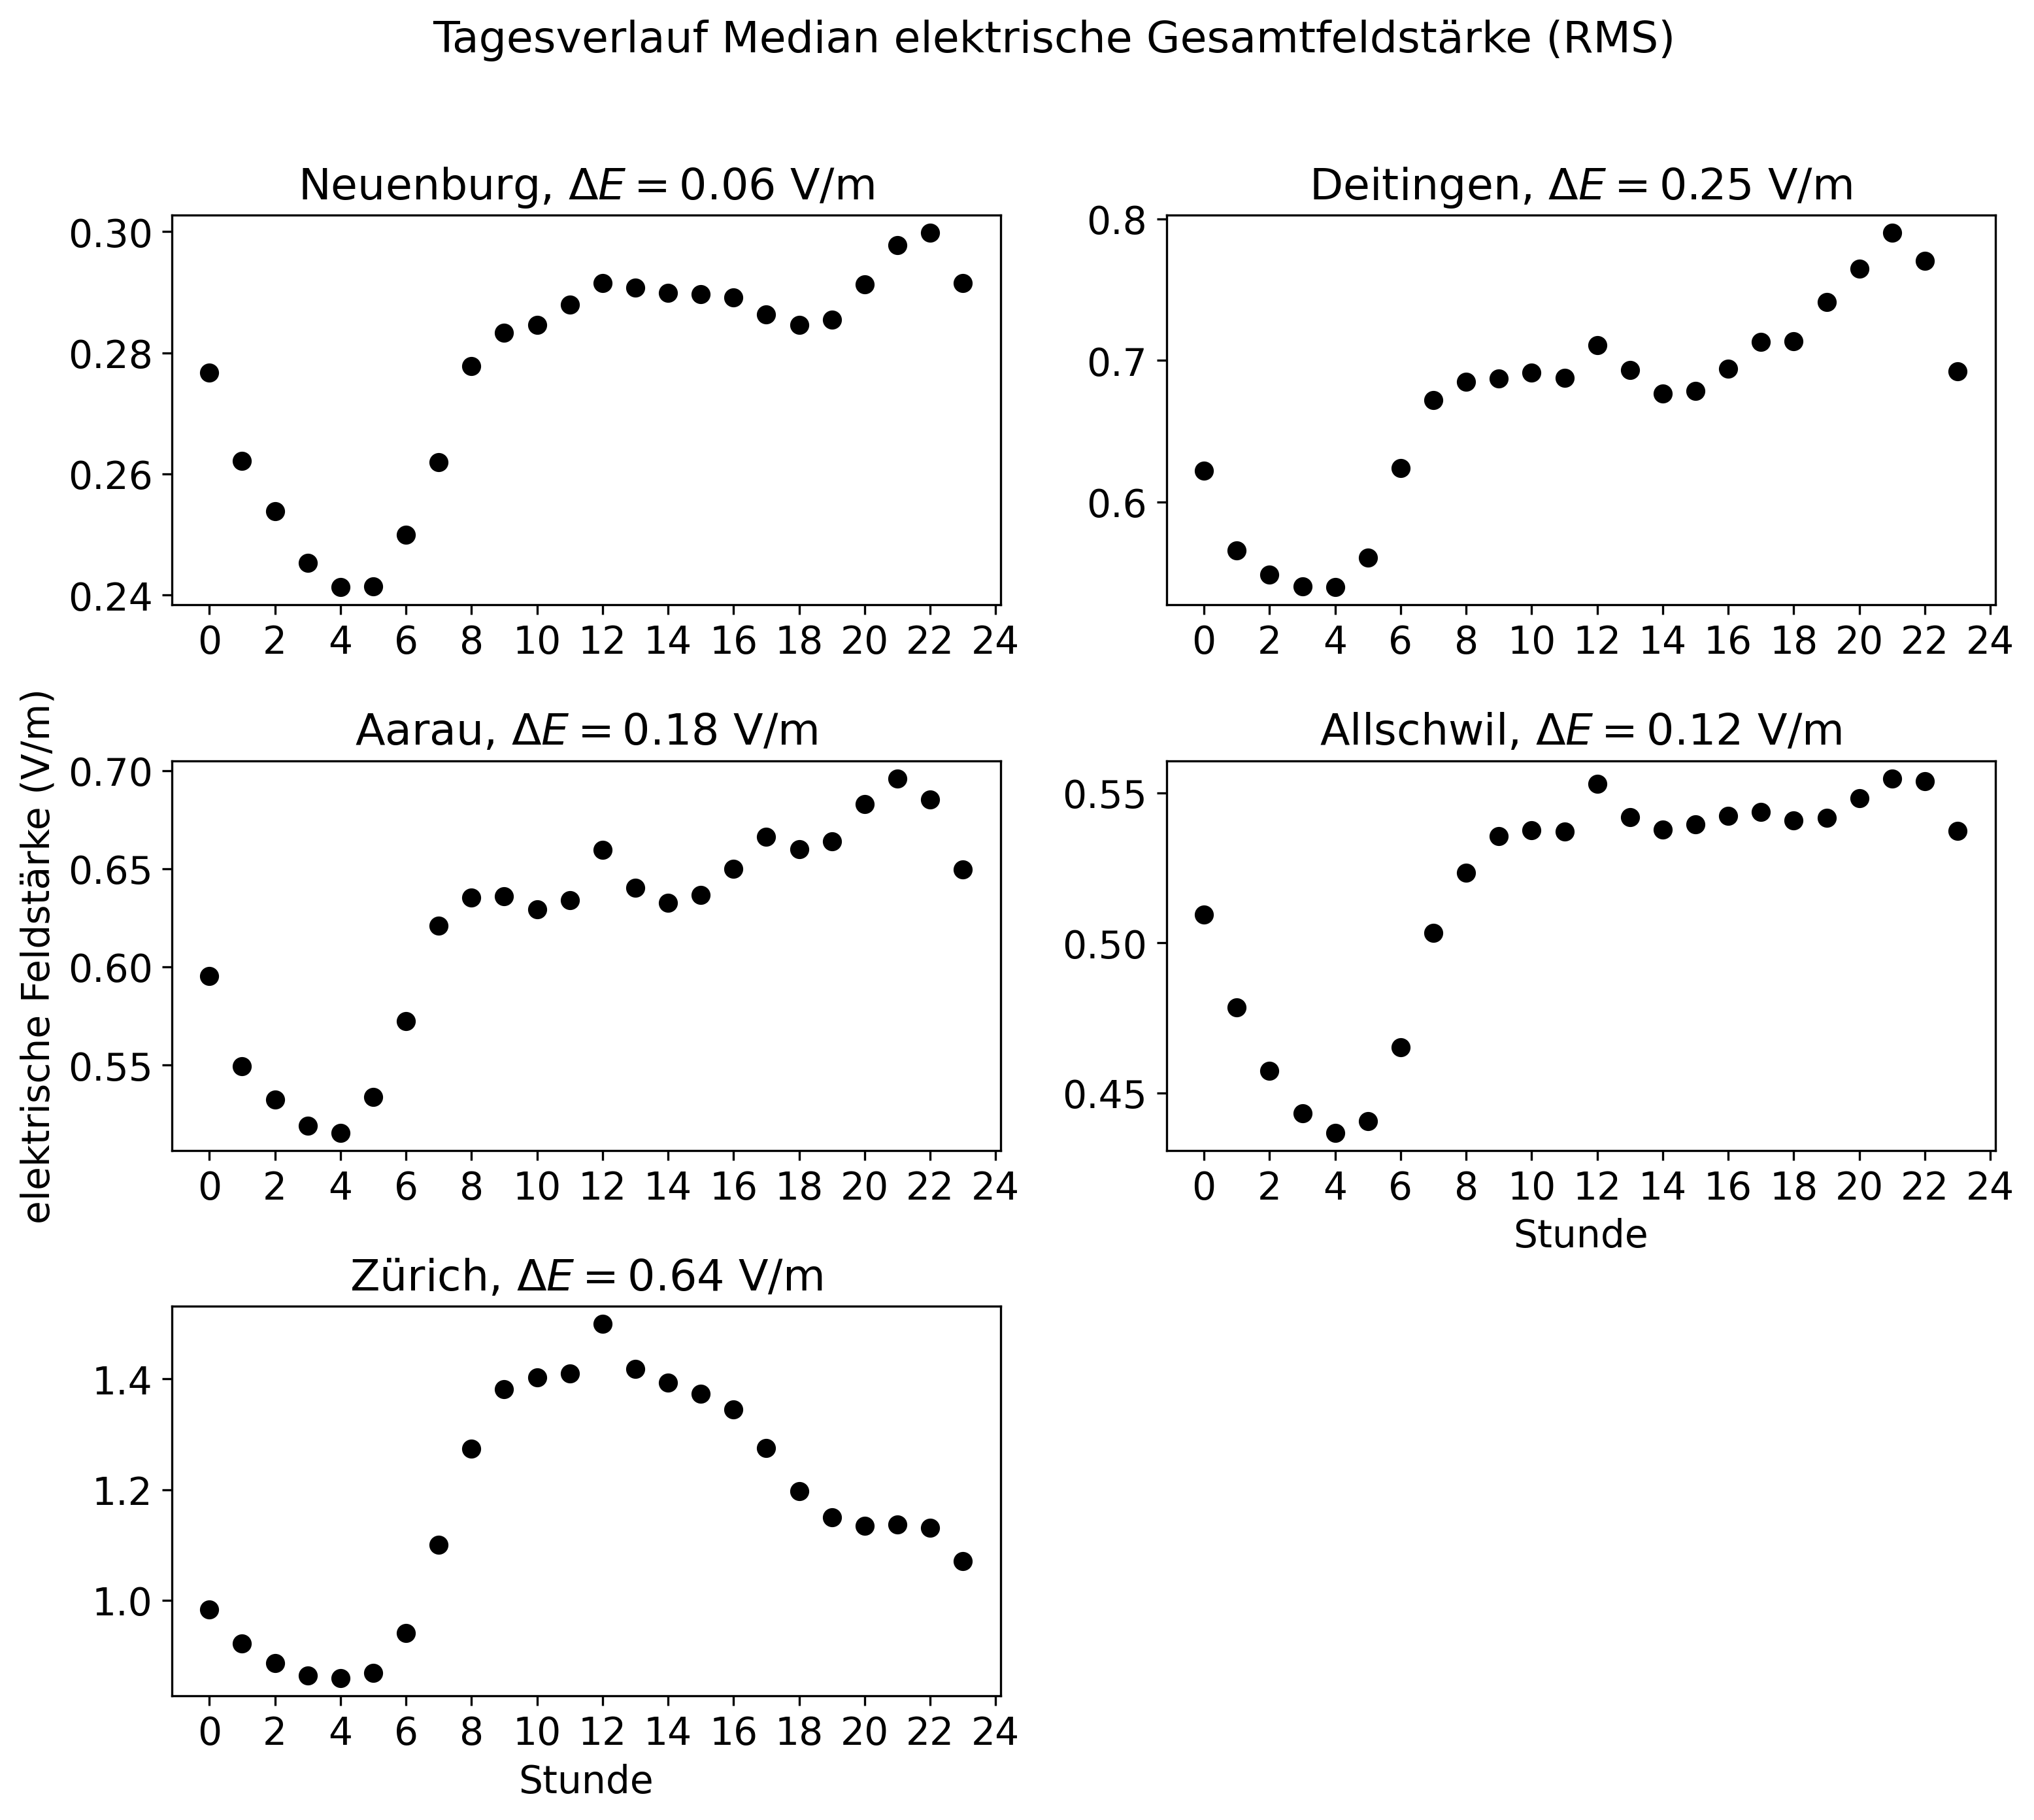
Daily progression of the LF-EMF median values. To make the temporal progression of the median values more visible, the field strength axes have different value ranges. The maximum daily fluctuation of the median values is given by the ΔE value.
Our study can be read here: https://www.newsd.admin.ch/newsd/message/attachments/89990.pdf
Team of authors Study: Dominik Haas (G+P), Nicolas Loizeau (TPH), Marco Zahner (FaW), Christa Stephan (G+P), Johannes Schindler (G+P), Michal Kovacik (G+P), Erik Bühlmann (G+P), Markus Gugler (NED-TECH), Jürg Fröhlich (FaW), Martin Röösli (TPH), Toni Ziegler (G+P).
/www.gundp.ch/file/2626/1.png)
/www.gundp.ch/file/2625/2.png)
/www.gundp.ch/file/2624/3.png)
/www.gundp.ch/file/2623/4.png)
/www.gundp.ch/file/2622/5.png)
/www.gundp.ch/file/1582/K%C3%BChle_Bel%C3%A4ge_Quadratisch.jpg)
/www.gundp.ch/file/1625/CPX_Jaun_Quadratisch.jpg)
/www.gundp.ch/file/2139/Titelbild_Elektrische_und_Magnetische_Felder.png)